
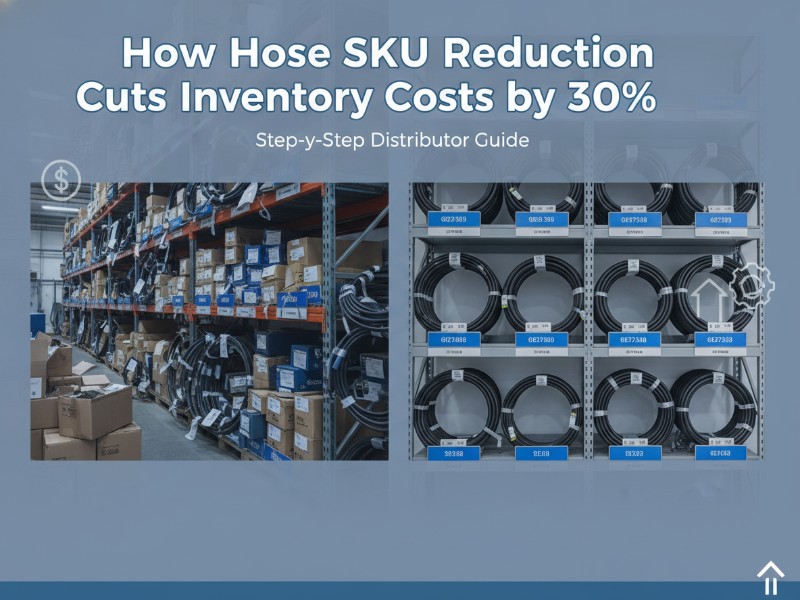
Hose distributors today face rising inventory costs, slow-moving SKUs, and increasing pressure to improve service levels while reducing working capital. One of the most effective strategies is hose SKU reduction—also known as inventory rationalization. Hose SKU reduction is not about stocking fewer products—it is about stocking the right products. This comprehensive guide provides data-backed strategies to reduce inventory costs by 20-30%, improve warehouse efficiency, and maintain or enhance customer service levels.
Hose SKU reduction cuts distributor inventory costs by 20-30% through eliminating low-turnover products, consolidating overlapping specifications, increasing purchasing power with fewer suppliers, and improving warehouse efficiency. Most industrial hose distributors can reduce SKU count by 30-50% without negatively impacting service levels or customer satisfaction.
This guide answers critical questions: How many SKUs should a distributor carry? What is inventory turnover ratio? How to standardize to SAE 100R2, EN 853 2SN, or ISO 18752 specifications? We provide implementation frameworks, real-world case studies, and actionable tools to help you optimize inventory while improving profitability.
Section 1: Understanding Hose Inventory Challenges
What Is Hose Inventory Optimization?
Answer: Hose inventory optimization is the strategic process of determining the optimal mix and quantity of hose products to stock, balancing customer service requirements with inventory carrying costs through SKU rationalization, demand forecasting, and supplier partnerships.
What Is Dead Stock in Hose Distribution?
Answer: Dead stock refers to inventory items that have had no sales activity for 12 months or more. In hose distribution, dead stock typically represents 15-25% of total inventory value and is a primary target for SKU reduction initiatives.
What Is Service Level in Inventory Management?
Answer: Service level is the probability that inventory will be available when a customer orders. A 95% service level means that out of 100 orders, 95 will be fulfilled immediately from stock without backorder or delay.
The Hidden Cost of SKU Proliferation
Many distributors suffer from “SKU creep”—the gradual accumulation of product variations that begins with good intentions (serving a specific customer request) but results in excessive complexity. Industry data reveals that managing over 15,000 unique SKUs is not uncommon in the hose distribution sector, with each additional SKU adding hidden costs across procurement, warehousing, and order fulfillment.
80% of hose distributor revenue typically comes from less than 20% of SKUs. This Pareto principle means that the majority of inventory investment is tied up in products that generate minimal returns.
Real-World Impact: One agricultural equipment manufacturer discovered their hydraulic hose inventory had grown to over 15,000 unique part numbers, many serving narrow applications. After implementing consolidation strategy, they achieved 23% annualized cost savings through supplier rationalization and part re-use.
Section Takeaway: SKU proliferation creates hidden costs across every operational function. Identifying and addressing the 80/20 imbalance is the foundation of effective inventory optimization.
Section 2: Why Consolidate Hose Lines Now?
What Industry Trends Are Driving Hose Inventory Consolidation?
Answer: The hose distribution industry is consolidating at all levels due to customer centralization, digital transformation requirements, margin compression, and supply chain optimization pressures. Distributors who delay consolidation risk being outcompeted by more efficient players.
Key Market Drivers:
| Driver | Impact on Distributors |
|---|---|
| Customer centralization | Purchasing decisions consolidated across locations; demand for consistent pricing and service |
| Digital transformation | Need for accurate, real-time inventory data across all channels |
| Margin compression | Gross margins declining from 15-25% to 10-15% requires operational efficiency |
| Supply chain optimization | 25-30% logistics cost reduction through better packaging and product standardization |
| Competitive pressure | Large players leveraging economies of scale and superior digital capabilities |
After standardization, distributors can reduce total SKU count by 40-60% while maintaining full application coverage. This is not theoretical—it has been achieved repeatedly across the industry.
Who Should Implement Hose SKU Reduction?
- Hydraulic hose distributors serving mobile equipment, agriculture, and construction
- Oil & gas service companies requiring extensive hose inventory for drilling and production
- Construction equipment suppliers managing diverse fleet requirements
- Industrial MRO distributors supporting manufacturing and processing facilities
- Chemical and pharmaceutical hose suppliers with stringent compliance requirements
Section Takeaway: Industry consolidation is accelerating. Distributors who act now will gain competitive advantage through lower costs and better service.
Section 3: How Hose SKU Reduction Lowers Inventory Costs
What Costs Are Affected by Hose Inventory Consolidation?
Answer: SKU reduction affects five primary cost categories: carrying costs (warehousing, insurance, capital tie-up), procurement costs, warehouse labor, obsolescence write-offs, and order processing costs. Typical reductions range from 15-60% across these categories.
Cost Reduction Breakdown
1. Reduced Holding Costs (Typically 20-30% of Product Value)
- Warehousing: Fewer SKUs require less storage space, enabling reduced facility costs or better utilization
- Capital: Less money tied up in slow-moving inventory—for a $5M inventory, 30% SKU reduction typically frees $500,000-$1,000,000 in working capital
- Insurance & Taxes: Lower inventory values directly reduce these carrying costs
- Obsolescence: Eliminating slow-movers reduces write-offs by 40-60%
2. Volume Purchasing Power
Example: A distributor carrying 500 hose SKUs from 20 suppliers averaging $50,000 annual spend each can consolidate to 200 SKUs from 8 strategic suppliers. Each supplier now receives $125,000+ annually, qualifying for volume discounts of 5-12%. This creates immediate margin improvement.
3. Operational Efficiency Gains
- Picking Time: Warehouse staff spend 20-40% less time searching for products
- Order Accuracy: Fewer similar-looking products reduce picking errors by 15-25%
- Receiving & Put-away: Less variety simplifies receiving inspection and storage placement
- Training: Staff require less training to master reduced product range
Hydraulic hose inventory management is fundamentally about balancing investment with availability. SKU reduction enables this balance by focusing resources on what actually sells.
| Cost Category | Typical Reduction | Primary Driver |
|---|---|---|
| Carrying costs | 15-30% | Fewer units, lower average inventory |
| Procurement costs | 10-20% | Fewer suppliers, larger POs |
| Warehousing labor | 15-25% | Reduced picking/searching time |
| Obsolescence write-offs | 40-60% | Elimination of slow movers |
| Order processing | 10-15% | Fewer supplier POs to manage |
Section Takeaway: SKU reduction delivers comprehensive cost savings across multiple operational areas. The financial impact compounds across holding costs, procurement, and labor.
Section 4: How to Standardize Hydraulic Hose Specifications
Standardization is the most powerful tool for SKU rationalization. By reducing specification variety, distributors can dramatically cut SKU counts while maintaining application coverage.
What Hose Standards Should Distributors Know?
Answer: Key hose standards include SAE 100R1 (wire-braid hydraulic), SAE 100R2 (high-pressure wire-braid), EN 853 2SN (European equivalent to SAE 100R2), EN 856 4SP/4SH (spiral-wire high-pressure), ISO 18752 (high-pressure hydraulic), API 7K (oilfield applications), and MSHA (mining) requirements. Distributors serving international markets should also be familiar with REACH and RoHS compliance for EU buyers.
What Is EN 853 2SN Hydraulic Hose Standard?
Answer: EN 853 2SN is the European standard for two-wire-braid high-pressure hydraulic hoses, equivalent to SAE 100R2. It specifies construction, dimensions, and performance requirements for hoses used in high-pressure hydraulic applications. This standard is widely accepted globally for mobile and industrial equipment.
Standardization Framework
1. Working Pressure Standardization
- Instead of stocking 100, 150, 200, 250, and 300 psi hose, stock only 200 psi and 300 psi
- Replace lower-rated hoses with higher-rated equivalents (safety margin improves)
- Industry Best Practice: Standardize to SAE 100R2, EN 853 2SN, or ISO 18752 specifications depending on application—these cover 70-80% of hydraulic applications
2. Size Standardization
- Replace fractional sizes with metric equivalents where possible
- Stock common sizes: -4, -6, -8, -10, -12, -16 (versus stocking every fractional and metric size)
- Eliminate sizes with less than 5 units/year sales
3. Material Standardization
- Consolidate multiple elastomer compounds to versatile, multi-purpose materials
- Consider nitrile (NBR) as primary for oil resistance, replacing specialized compounds
- Standardize on synthetic rubber constructions where applications permit
4. Length Standardization
- Stock standard lengths (50ft, 100ft) rather than custom cuts
- Implement on-site cutting capabilities for custom lengths
- Eliminate non-standard lengths that move less than 10 units/month
Standardization: Before vs After
| Specification Area | Before Consolidation | After Consolidation | SKU Reduction |
|---|---|---|---|
| Working pressures | 5 variations | 2 variations | 60% |
| Sizes (hydraulic) | 25 variations | 12 variations | 52% |
| Material compounds | 8 compounds | 4 compounds | 50% |
| Length options | 20 variations | 4 variations | 80% |
| Total SKU Impact | Baseline | 40-60% reduction | 40-60% |
After standardization, distributors can reduce total SKU count by 40-60% while maintaining full application coverage. This represents the single largest opportunity for SKU reduction.
Section Takeaway: Standardization to SAE, EN, or ISO specifications reduces SKU counts by 40-60% without compromising application coverage. This is the highest-ROI consolidation activity.
Section 5: Common Mistakes in Hose SKU Reduction
Even experienced distributors make avoidable errors during consolidation. Recognizing these common pitfalls helps ensure successful implementation.
Mistake 1: Eliminating SKUs Without Customer Validation
The Problem: Internal analysis identifies slow-moving SKUs, but customers may rely on them for critical applications. Eliminating these without notice damages relationships.
The Solution:
- Survey top 20% of customers before making changes
- Ask specifically about products they consider “essential”
- Provide 6-12 month phase-out period with multiple notifications
- Offer special-order options for eliminated products
Mistake 2: Over-Standardizing and Losing Niche Applications
The Problem: In pursuit of simplification, distributors eliminate products that serve profitable niche markets, losing revenue and competitive advantage.
The Solution:
- Distinguish between “core” products (high volume, standard applications) and “specialty” products (lower volume, high margin, competitive differentiators)
- Maintain specialty items that generate >40% margin, even with low volume
- Review specialty portfolio quarterly to ensure profitability
Mistake 3: Ignoring Supplier Capability Gaps
The Problem: Consolidating to fewer suppliers without assessing their ability to meet needs creates stockout risk and service failures.
The Solution:
- Evaluate supplier performance history (on-time delivery, quality, lead times)
- Assess supplier capability to support your consolidated product line
- Maintain backup suppliers for critical product categories
Mistake 4: Cutting SKUs Without Adjusting Safety Stock
The Problem: When SKUs are eliminated, demand shifts to remaining products. If safety stock isn’t adjusted upward, stockouts increase.
The Solution:
- Recalculate demand for remaining SKUs after consolidation
- Increase safety stock by 10-20% during transition period
- Monitor stockout rates closely for 6 months post-consolidation
Mistake 5: Not Tracking Post-Consolidation Performance
The Problem: Many distributors consolidate and move on without measuring results, missing opportunities for further optimization and failing to correct issues.
The Solution:
- Track key metrics: inventory turnover, stockout rate, picking accuracy, customer satisfaction
- Review quarterly for first 12 months
- Adjust strategy based on data
How to Know If SKU Reduction Is Too Aggressive?
Answer: Warning signs include: customer complaints about product unavailability, increased special order requests, declining customer satisfaction scores, reduced order fill rates, and employees spending more time on exception handling. Monitor these indicators weekly during implementation.
Section Takeaway: Successful SKU reduction requires careful execution. Learning from common mistakes prevents operational disruptions and customer dissatisfaction.
Section 6: Top 20 Hose SKUs Every Distributor Should Stock
This representative portfolio covers 70-80% of industrial hydraulic applications while maintaining manageable SKU counts.
Hydraulic Hose (SAE/EN Standards)
| Standard | Sizes | Applications | Stock Priority |
|---|---|---|---|
| SAE 100R1 / EN 853 1SN | -4, -6, -8, -10, -12 | Low-medium pressure hydraulic, return lines | ★★★★★ |
| SAE 100R2 / EN 853 2SN | -6, -8, -10, -12, -16 | High-pressure hydraulic, mobile equipment | ★★★★★ |
| SAE 100R4 | -8, -12, -16, -20 | Suction and return lines | ★★★★ |
| SAE 100R12 | -10, -12, -16 | High-impulse hydraulic | ★★★ |
| EN 856 4SP | -10, -12, -16 | High-pressure, high-impulse | ★★★★ |
| ISO 18752 (high-pressure) | -8, -10, -12 | Very high-pressure applications | ★★★ |
Industrial Hose
| Type | Sizes | Applications | Stock Priority |
|---|---|---|---|
| Air/Water (EPDM) | 1/2″, 3/4″, 1″, 1.5″ | General pneumatic and water | ★★★★★ |
| Petroleum (NBR) | 1/2″, 3/4″, 1″ | Oil, fuel, chemical transfer | ★★★★ |
| Steam | 1/2″, 3/4″, 1″ | Steam cleaning, processing | ★★★ |
| Food Grade (FDA) | 1/2″, 3/4″, 1″ | Food and beverage transfer | ★★★ |
| Washdown | 1/2″, 3/4″ | Sanitary cleaning applications | ★★★ |
Fittings and Couplings
| Type | Applications | Stock Priority |
|---|---|---|
| Crimp fittings (standard sizes) | Hose assembly fabrication | ★★★★★ |
| Reusable fittings | Field repair | ★★★★ |
| Quick-release couplings | Rapid connect/disconnect | ★★★★ |
| Camlock couplings | Bulk transfer | ★★★ |
Most distributors overestimate demand diversity and underestimate SKU redundancy. This portfolio demonstrates that most applications can be served with 100-200 core SKUs, not 1,000+.
Section Takeaway: A focused portfolio of 100-200 core SKUs typically covers 70-80% of applications while dramatically reducing inventory costs.
Section 7: How to Optimize Hose Stock Levels with ABC Analysis
ABC Analysis Framework
| Category | % of SKUs | % of Revenue | Stock Strategy |
|---|---|---|---|
| A Items | Top 20% | 80% | High safety stock (4-6 weeks); automated reorder points; VMI preferred |
| B Items | Middle 30% | 15% | Moderate safety stock (2-4 weeks); scheduled reorder cycles |
| C Items | Bottom 50% | 5% | Minimal safety stock; eliminate or special-order where possible |
Key Insight: By focusing inventory investment on A items, distributors can dramatically improve service levels while reducing total inventory value. The C items that create disproportionate costs should be primary targets for elimination.
Reorder Point Calculation
Formula: Reorder Point = (Daily Usage × Lead Time) + Safety Stock
Example: A hydraulic hose SKU with 10 units/day usage, 14-day lead time, and 20 units safety stock:
- Reorder Point = (10 × 14) + 20 = 160 units
When inventory reaches 160 units, a new order is triggered. This systematic approach prevents stockouts while minimizing excess inventory.
Section Takeaway: ABC analysis directs inventory investment to where it generates the highest returns. C items are primary consolidation candidates.
Section 8: How Distributors Can Choose the Right Hose Supplier After SKU Reduction
After consolidating SKUs, selecting the right supplier partners becomes critical. The right supplier supports your consolidation goals rather than undermining them.
Supplier Selection Criteria
1. Product Coverage
- Can the supplier cover 80%+ of your core SKU requirements?
- Do they offer the standards you need (SAE, EN, ISO, API)?
- Are they committed to maintaining product consistency?
2. Quality Certification
- ISO 9001 certification (minimum)
- NAHAD compliance for hose assemblies
- Industry-specific certifications (API, MSHA, FDA)
- In-house testing capabilities
3. Lead Time Reliability
- Consistent on-time delivery (95%+ target)
- Clear lead time communication
- Emergency order capability
- Safety stock buffer availability
4. Value-Added Services
- Vendor-Managed Inventory (VMI) programs
- Custom assembly and kitting
- Technical support and training
- Online ordering and real-time inventory visibility
5. Financial Stability
- Long-term viability (financial strength rating)
- Investment in manufacturing capability
- Global presence for export support
Supplier Consolidation Benefits
| Aspect | Before Consolidation | After Supplier Consolidation |
|---|---|---|
| Number of suppliers | 10-20 | 3-8 |
| Average spend per supplier | $50,000-$100,000 | $150,000-$500,000+ |
| Volume discount potential | 0-5% | 5-12% |
| Supplier relationship depth | Transactional | Partnership |
| VMI implementation | Difficult | Feasible |
| Order processing cost | High | Reduced 30-50% |
Supplier consolidation is the fastest way to unlock trapped working capital in hose distribution.
Industrial hose supplier optimization requires balancing cost, quality, and service capability. The right supplier partnership enables SKU reduction while maintaining service levels.
Section Takeaway: Strategic supplier partnerships amplify the benefits of SKU reduction. Volume consolidation with fewer suppliers generates discounts and improved service.
Section 9: Case Study: Distributor Achieves 32% Cost Reduction
Company Profile: Mid-sized industrial distributor serving manufacturing, construction, and agricultural sectors in the Midwestern United States. Annual revenue: $28M. Product categories: hydraulic and industrial hose, fittings, and assemblies.
| Metric | Before | After | Change |
|---|---|---|---|
| Active SKUs | 2,800 | 1,100 | -61% |
| Inventory value | $6.2M | $4.2M | -32% |
| Inventory turnover | 3.8x | 5.6x | +47% |
| Supplier count | 14 | 6 | -57% |
| Average PO size | $4,200 | $8,900 | +112% |
| Stockout rate | 6.2% | 4.1% | -34% |
| Picking error rate | 2.8% | 1.9% | -32% |
| Annual obsolescence write-off | $215,000 | $88,000 | -59% |
Implementation Timeline: 9 months
Key Success Factors:
- Executive sponsorship and clear goals
- Customer engagement throughout the process
- Supplier partnership with primary vendors
- Systematic SKU review using ABC analysis
- Investment in inventory management technology
Result: Annualized cost savings of $780,000 (12.3% of inventory value) with improved service levels and customer satisfaction.
Hose distribution efficiency improves dramatically when SKU reduction is implemented systematically. This case study demonstrates that significant savings are achievable across all operational metrics.
Section Takeaway: Real-world evidence confirms that 30-50% SKU reduction delivers 20-30% cost savings while improving service levels.
Section 10: Implementation Roadmap
Phase 1: Assessment and Analysis (Months 1-3)
Step 1: Comprehensive SKU Audit
- Document every SKU with specifications and sales history
- Calculate carrying costs for each SKU
- Identify zero-movement and slow-moving items (12+ months with no sales)
- Flag items with <5 units/year sales
Step 2: Customer Engagement
- Survey top 20% customers about essential products
- Analyze order patterns to identify minimum required variety
- Document critical applications and requirements
Step 3: Supplier Assessment
- Evaluate supplier performance and reliability
- Determine which suppliers can support consolidation
- Identify value-added services (VMI, kitting, custom labeling)
Phase 2: Strategy Development and Rollout (Months 4-8)
Step 4: Create Rationalized Product Line
- Apply ABC analysis to categorize SKUs
- Standardize specifications (pressure, size, material)
- Determine “core” and “specialty” product categories
- Develop elimination timeline with customer notifications
Step 5: Supplier Negotiation
- Consolidate purchases with preferred suppliers
- Negotiate volume discounts based on increased spend
- Implement VMI programs where feasible
Phase 3: Optimization and Refinement (Months 9+)
Step 6: Continuous Improvement
- Monitor SKU performance quarterly
- Review customer feedback and adjust accordingly
- Implement automated reorder system
- Integrate consolidation into annual planning
Step 7: Technology Enablement
- Implement real-time inventory tracking
- Set automated reorder points for key SKUs
- Connect systems with key suppliers
- Track performance metrics for ongoing optimization
Section Takeaway: A structured 9-month implementation approach minimizes disruption while maximizing results. Phased implementation allows course correction based on feedback.
Section 11: Frequently Asked Questions
How long does hose inventory consolidation take?
Most distributors complete initial consolidation within 6-12 months, with ongoing optimization continuing indefinitely. Assessment phase: 2-3 months. Implementation: 3-6 months. Optimization: ongoing.
Can small distributors benefit from SKU reduction?
Yes. Small distributors often have the most to gain because their inventory investment is more constrained and carrying costs represent a higher percentage of revenue. A 30% SKU reduction can increase available working capital by 15-25%.
Does reducing SKUs mean stocking less inventory?
Not necessarily. You’re reallocating inventory investment from slow-moving SKUs to high-demand items. Total inventory value typically decreases 20-30%, but customers have better availability of the products they actually purchase.
What is a realistic SKU reduction target?
Most distributors can reduce SKU counts by 30-50% without negatively impacting customer service or revenue. Highly fragmented operations may achieve 60%+ reductions.
How to know if SKU reduction is too aggressive?
Warning signs include: customer complaints about product unavailability, increased special order requests, declining customer satisfaction scores, reduced order fill rates, and employees spending more time on exception handling.
What is the difference between SAE 100R1 and SAE 100R2?
SAE 100R1 is a single-wire-braid hydraulic hose suitable for medium-pressure applications. SAE 100R2 is a double-wire-braid hose for higher-pressure applications. SAE 100R2 offers higher working pressure and greater safety margin.
What is EN 853 2SN hydraulic hose standard?
EN 853 2SN is the European standard for two-wire-braid high-pressure hydraulic hoses, equivalent to SAE 100R2. It specifies construction, dimensions, and performance requirements for hoses used in high-pressure hydraulic applications.
Is ISO 18752 replacing older standards?
ISO 18752 is gaining traction as a global standard for high-pressure hydraulic hoses, particularly for high-impulse applications. It complements rather than replaces SAE and EN standards, offering additional classification levels.
Section 12: Expert Insights
SKU reduction is the fastest way to unlock trapped working capital in hose distribution. Most businesses have 30-50% of their inventory tied up in products that generate minimal revenue. Eliminating or reducing these frees capital for growth.
Carrying more SKUs does not improve service—stocking the right SKUs does. Service level is determined by availability of the products customers actually want, not by the total number of products offered. Focus inventory on what sells, not what you hope might sell.
Most distributors overestimate demand diversity and underestimate SKU redundancy. Our analysis consistently shows 3-5 equivalent products from different suppliers covering identical applications. Consolidating these is the lowest-risk, highest-return consolidation opportunity.
In most hose distribution businesses, SKU complexity is not driven by customer demand—but by historical accumulation and supplier overlap. Breaking this pattern requires systematic analysis and disciplined execution.
The best time to consolidate was yesterday. The second-best time is now. Every day of delay represents unnecessary carrying costs, and competitors are already implementing consolidation strategies to gain market advantage.
Section 13: Hose SKU Reduction Checklist
Pre-Assessment (Months 1-2)
- Export complete inventory list with sales data
- Calculate carrying cost percentage (target: 20-30% of inventory value)
- Identify zero-movement items (12+ months)
- Identify items with <5 units/year sales
- Calculate inventory turnover ratio by product category
- Survey top 20% customers about essential products
ABC Analysis (Month 3)
- Categorize SKUs into A, B, C groups
- Identify redundant products across suppliers
- Flag duplicate specifications
- Evaluate standardization opportunities
Strategy Development (Month 4)
- Develop elimination list with timeline
- Create customer notification plan
- Negotiate supplier consolidation
- Set new reorder points for retained SKUs
Implementation (Months 5-8)
- Phase out eliminated SKUs (provide 90-180 day notice)
- Reorganize warehouse for new product line
- Retrain staff on new inventory processes
- Update inventory system and documentation
- Announce new product focus to customers
Optimization (Months 9+)
- Monitor service levels and customer satisfaction
- Track inventory turnover improvements
- Quarterly SKU performance review
- Annual consolidation review and update
Free Hose Inventory Analysis: SKU Reduction Report in 48 Hours
Stop guessing. Start optimizing.
HENGHUA offers a Free Hose Inventory Analysis that delivers actionable insights within 48 hours.
What You Receive:
SKU Redundancy Identification – We analyze your current product mix and identify duplicate or overlapping SKUs that can be eliminated
Standardization Recommendations – Expert guidance on consolidating specifications to SAE, EN, or ISO standards
Cost Savings Estimate – Detailed projection of inventory cost reduction, working capital release, and operational savings
Implementation Roadmap – Customized 9-12 month plan tailored to your business size and customer base
Supplier Optimization Analysis – Assessment of supplier consolidation opportunities and volume discount potential
How It Works:
- Submit your current inventory list (Excel/CSV format)
- Our team analyzes within 48 hours
- Receive a comprehensive report with actionable recommendations
- Schedule a consultation to discuss implementation
Why HENGHUA?
- 25+ years of industrial hose manufacturing experience
- Global presence: North America, Europe, Asia, Middle East
- Full compliance: SAE, EN, ISO, API, MSHA, REACH, RoHS
- Dedicated distributor support team
[Request Your Free Inventory Analysis Now] – No obligation. Just data-driven insights to reduce costs and improve profitability.
Consolidated vs Traditional Hose Inventory
| Aspect | Traditional Approach | Optimized Approach |
|---|---|---|
| SKU count | 2,000+ | 300-800 |
| Inventory turnover | 2-4x/year | 5-8x/year |
| Dead stock percentage | 15-25% | <5% |
| Supplier count | 10-20 | 3-8 |
| Picking time per order | 8-12 minutes | 4-6 minutes |
| Order accuracy | 95-97% | 98-99% |
| Obsolescence write-offs | 3-5% of inventory/year | 1-2% of inventory/year |
| Warehouse space utilization | 65-75% | 80-90% |
| Customer fill rate | 92-95% | 95-98% |
Compared to traditional inventory models, consolidated hose portfolios achieve higher turnover, lower dead stock, and better service levels with fewer SKUs. This comparison demonstrates the comprehensive advantage of SKU rationalization.

 English
  Spanish
  Portuguese
  French
  German