
To read a hose chemical resistance chart, find the four conditions behind each rating: the medium and its concentration, the temperature, the exposure time, and whether contact is continuous or intermittent. Treat the printed grade as a screening aid, not a decision. The chart tells you where to look; it does not tell you what will happen to your hose.
This article shows how the class letters and numbers are built, why a single word such as “good” is unusable on its own, and how to turn a general chart into a one-page working document for your own media list. It is written for the reader who already has a chart in hand and needs to know whether a printed grade covers a real duty, and it stays on the reading task.
1. What a Hose Chemical Resistance Chart Actually Is
A hose chemical resistance chart is a grid. It places the media down one axis and the candidate tube materials across the other, and prints a grade in each cell. That grade summarizes how a tube material behaved when it was exposed to a medium. A compressed cell hides the conditions the grade was measured under, and a chemical resistance table is the same grid under another name: a summary of test results, not a promise about your duty.
Two charts can disagree about the same medium and the same material without either being wrong, because they were measured under different conditions. A rating is a statement about a sample under stated conditions, not a property of the material itself. Reading a chart well means recovering those conditions before you trust the grade.
Read the axis labels before anything else, because a chart that lists families of chemicals is coarser than one that lists named media. A cell for a family applies to the family as a whole, and the individual member of that family in your line may behave differently. When the medium on your list and the medium on the axis are not the same, the grade is not yet yours.
The reading rule is the same for a chart in any format. A chart printed on a page, held as a PDF, or shown on a screen hides its header row just as easily. A reader who asks whether a chart’s good grade applies to their own medium at their own temperature is asking the same four-field question.
Before you compare charts, it helps to know what each tube material is for. The chemical hose category lists the compounds a supplier offers, and that list is the set of rows you will actually be searching.
2. How to Read a Hose Chemical Resistance Chart: The Four Fields Behind Every Rating
Every honest rating depends on four fields. If any one of them is missing, the grade cannot be applied to your service with confidence. The four fields are the medium identity including its chemical concentration, the temperature, the exposure duration, and the contact pattern, that is whether contact is continuous or intermittent.
Read a chart by finding the header rows first, not the cell. The header rows carry these four fields; the cell carries only the grade. A hose material compatibility decision needs all four as input, and a chart alone does not supply them, so the missing fields become questions to the supplier.
Table 1. The four fields behind every chemical resistance rating, and what each one fixes
| Field | What it fixes | What goes wrong if you read it loosely | Where to record it |
|---|---|---|---|
| Medium identity and concentration | Which chemical, at which strength, because a dilute solution and a concentrated one can grade differently | You match a grade measured on a dilute solution to a concentrated duty | Medium, with the concentration printed next to it |
| Temperature | The thermal condition the sample was held at during exposure | You assume a grade measured at ambient applies at an elevated service temperature | The test temperature, and your service temperature range |
| Exposure duration | How long the sample was in contact with the medium | You extend a short-contact result to a long dwell time | The recorded contact time of the test |
| Contact pattern | Whether contact is continuous or intermittent, such as a transfer that empties and drains | You apply an intermittent rating to a line that stays full | Continuous or intermittent, stated per medium |
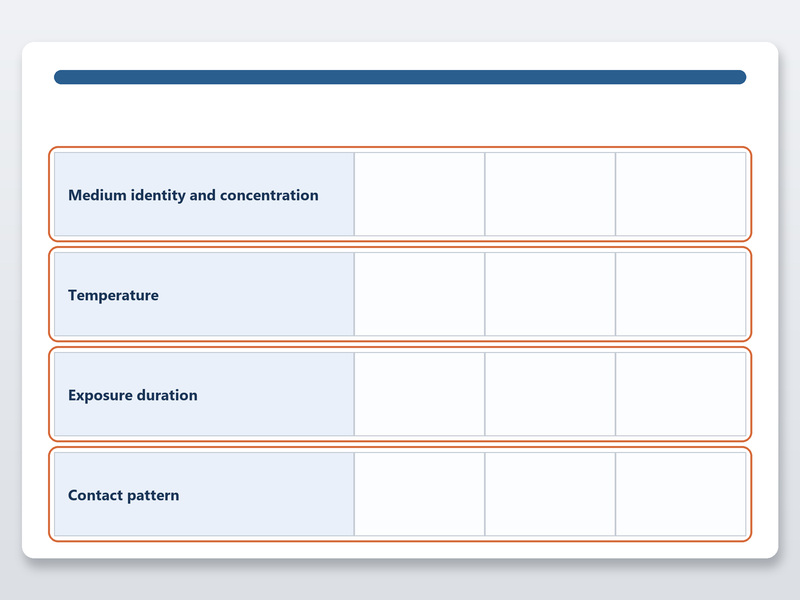
Figure 1. A printed chart fixes its rating with four header fields: medium and concentration, temperature, exposure duration and contact pattern. Read those before the grade.
The types of flexible hose materials page explains how the common compounds differ, which is the background a resistance chart assumes you already have.
3. Reading the Letter or Number Class Scale, and What It Does Not Claim
Published scales are not standardized across the industry. Some use letters, some use numbers, and the direction is not universal. On one chart a letter A may be the best grade and on another it may be the worst. The legend, not the letter, defines the scale. Read the legend on the chart in front of you every time.
The scale claims a relative ranking only, and its scope is the conditions the chart states. A service life, an absolute limit, and behavior at a different concentration, temperature or duration all sit outside the scale. A published hose chemical resistance chart, like any chemical resistance table, compresses a large test matrix into symbols that mean different things from one publisher to the next.
Table 2. How a published letter or number class scale is typically read (illustrative; it describes how such scales are structured, not a measurement of any material)
| Scale type | How the grade is written | What the grade claims | What it does not claim |
|---|---|---|---|
| Letter scale | One letter per cell, with best-to-worst order set by the legend | A relative ranking of the material against the medium under the stated conditions | An absolute life, or behavior at any other concentration, temperature or time |
| Number scale | One number per cell, with direction set by the legend | The same relative ranking, expressed as a level rather than a letter | Whether one end of the scale is the better grade without reading the legend |
| Temperature-banded scale | A separate cell or column per temperature band | How the grade is expected to shift as temperature rises within the bands printed | Any value outside the bands the chart prints |
| Duration-banded scale | A separate cell per exposure duration | How the grade is expected to shift with longer contact | Continuous service when the cell was measured on short contact |
4. Why “Good” Means Nothing Without Its Test Condition
A single word such as good or excellent is unusable on its own, because it describes a result that was measured under conditions the word does not carry. The word is the conclusion; the conditions are the evidence.
Consider one compound against one chemical. A chart may mark that compound good for a dilute solution at ambient temperature with short contact, then mark it poor for a more concentrated form of the same chemical at elevated temperature with continuous contact. Both entries are the same word, and both are correct for their own test condition. That is why you must read the word together with the medium, the chemical concentration, the temperature and the time.
The flexible hose materials guide sets out how these compounds behave in general terms; it does not replace the condition attached to a specific grade.
5. Is a Chart Enough, or Does the Duty Need an Immersion Test?
A chart is a screening aid and immersion testing is the decision tool. Screening narrows a long material list quickly, and that is worth doing. It does not settle a critical duty, because a printed grade omits the numbers a decision needs.
ASTM D471 covers rubber immersed in a liquid. ASTM D543 covers plastics exposed to chemical reagents. An immersion test reports volume swell, hardness change and tensile and elongation change for the material after a defined exposure. A chart reports none of those numbers; it reports a grade. Volume swell shows how much the tube grew, hardness change shows how the surface stiffened or softened, and tensile and elongation change show whether the material lost mechanical strength.
A standard can also bound a test. EN 12115:2021 covers chemicals in the range of −20 °C to +65 °C at a working pressure not above 10 bar. That 10 bar equals 145 psi (calculated as 10 × 14.50). Use the quoted condition as the frame, not just the number.
Choose the test duration to resemble the duty, because a short dip and a long soak can produce different results for the same material and liquid. Record the temperature and the duration with the result, since a number without its condition cannot be compared with anything. Where a standard applies to your service, quote the standard’s own range rather than a single point from it.
Table 3. What immersion testing reports and what a chart omits
| Method | Applies to | What it reports | What a chart omits |
|---|---|---|---|
| ASTM D471 | Rubber immersed in a liquid | Volume swell, hardness change, and tensile and elongation change after a defined exposure | The measured change values and the exact exposure used |
| ASTM D543 | Plastics exposed to chemical reagents | Mass and property change of a plastic specimen after a defined exposure | The specimen result and the reagent strength used |
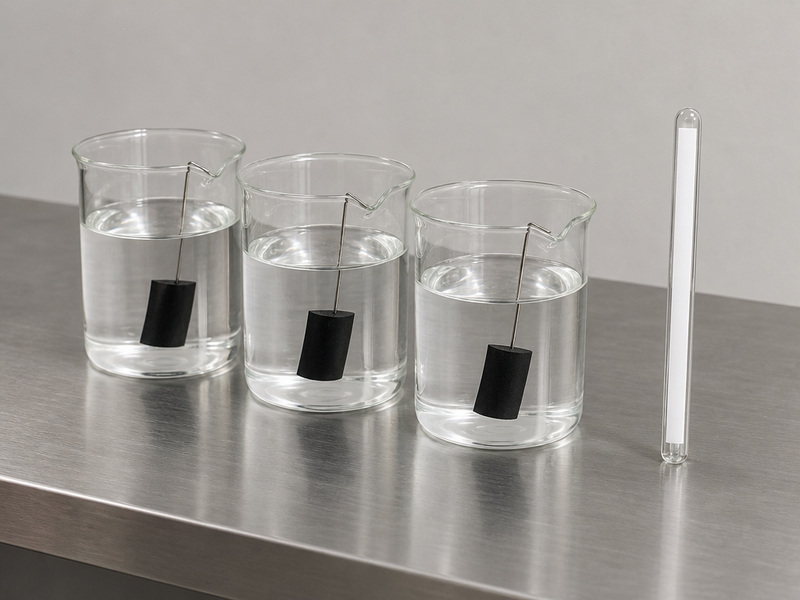
Figure 2. An immersion assessment measures one material, one liquid, one temperature and one duration.
Worked example: reading one cell to a decision
A chart cell prints good for a dilute acid, and your duty runs the same acid at a temperature inside the EN 12115:2021 quoted range of −20 °C to +65 °C, with continuous contact:
- Medium and concentration: confirm the strength your line runs, because the cell was measured on a dilute acid.
- Temperature: place your service range inside the quoted range, and check the cell’s own test temperature.
- Duration and contact: continuous contact outlasts a short dip, so ask which duration the cell was measured on.
- Decision: the cell settles the screening step, and the concentration and the duration still belong on an immersion request.
For a first pass over many media, compare the three common compounds, NBR (nitrile butadiene rubber), EPDM (ethylene propylene diene monomer rubber) and FKM (fluorocarbon rubber), before you order tests. The NBR versus EPDM versus FKM inner tube selection guide is that kind of first pass.
6. How Do Degradation and Permeation Fail a Hose Differently?
Chemical degradation and permeation are different failures, and a chart usually speaks to only one of them. Degradation is a change in the tube itself: it swells, softens, hardens, cracks or loses strength because the material reacted with the medium. Permeation is the passage of the medium through the wall, and it can occur with little visible change to the tube.
Degradation and permeation are often confused because both end in a wet or failed hose. A medium can permeate a tube without visibly degrading it, and a tube can degrade without a measurable permeation rate. Degradation is what immersion testing and a resistance chart describe. Permeation depends on wall thickness, temperature and chemical concentration as much as on the material, so a compatibility grade does not predict it.
Read a hose material compatibility rating as a statement about degradation, and treat permeation as a separate question for the tube wall. Ask about wall construction and any barrier layer when the medium is volatile or odorous.
Permeation also matters for safety, not only for the medium. A wall that passes a volatile liquid can carry vapor to the outside of the hose, where it may collect or reach an ignition source. When the medium is flammable or odorous, treat permeation as a required check rather than an afterthought, and ask the supplier how the wall handles it.
7. How to Build a Working Hose Chemical Resistance Chart
Build your own working chart from your media list, not from a supplier’s generic table. A plant-specific chart is short, current and tied to the conditions you actually run. It also gives operators one page to check instead of a binder of competing charts.
If you are a process engineer specifying a new line, read the four fields before you write the requisition. If you are a maintenance engineer checking an installed hose, start from the service conditions you can measure and work back to the chart row. If you are an EPC contractor or a distributor writing a datasheet, record all four fields so the entry stays usable after handover.
For each medium, the row should carry these entries:
- The medium name with its concentration
- The service temperature range
- The contact pattern, continuous or intermittent
- The chosen tube material
- The test basis, a chemical resistance table entry or an immersion result
- A review date and the person who approved it
Table 4. Columns for a one-page working chart and where each entry comes from
| Column | What goes in it | Where the entry comes from |
|---|---|---|
| Medium and concentration | The chemical name with its strength as used | Your process or tank list |
| Service temperature range | The lowest and highest temperature in normal and upset service | Process data, not ambient guesswork |
| Contact pattern | Continuous, or intermittent and draining | Operating procedure |
| Tube material | The compound selected for that medium | Chart screening, then confirmation |
| Test basis | The chart entry, or the immersion result reference | Screening aid or immersion result |
| Review date | The next date the entry must be checked | Your maintenance schedule |
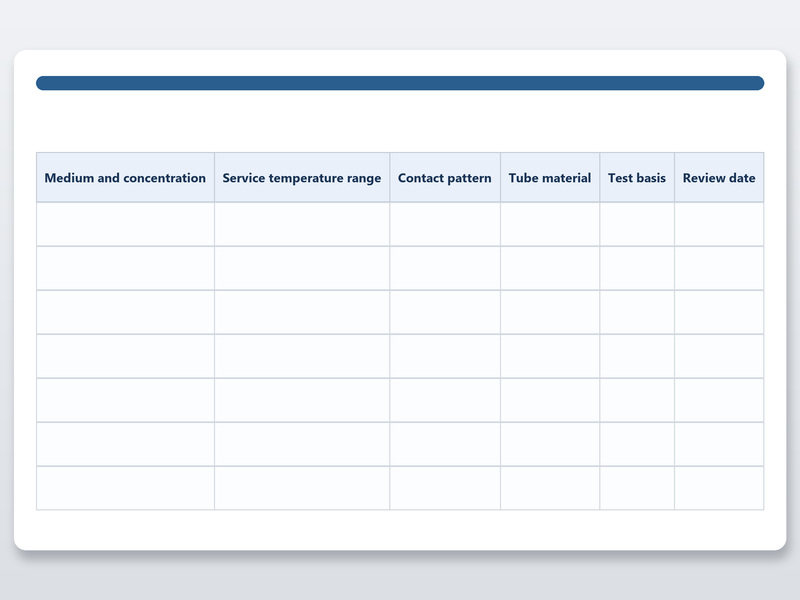
Figure 3. A one-page working chart records the six entries from Table 4 for your own media, not a generic grade.
An immersion result belongs in the test-basis column wherever the duty is critical, so the entry rests on a measurement rather than a grade. Keep the page short enough that operators read it, and send it to the chemical hose range supplier so the selections match what is actually stocked.
Review the page on a fixed cycle, and sooner whenever a process change alters a medium, a temperature or a contact pattern. A working chart that is out of date is worse than none, because operators will still trust it. Date each approval so the age of an entry is visible at a glance.
8. Which Mistakes Cause Hose Failures?
Most field failures from chart reading come from a small number of mistakes. Each one breaks the link between the grade and its test condition. When the link breaks, the grade still looks authoritative, which is what makes the error dangerous.
Table 5. Common chart-reading mistakes, why they fail, and how to avoid them
| Mistake | Why it fails | How to avoid it |
|---|---|---|
| Reading the row for the wrong chemical concentration | A grade measured on a dilute solution is applied to a concentrated duty | Match the exact concentration printed on the chart |
| Ignoring temperature | A rating measured at one temperature is applied at a much higher service temperature | Compare the test temperature with your service range |
| Reusing a chart across grades of the same compound | Cure, filler and plasticizer content differ between grades of one compound | Confirm the grade and the test behind the rating, and re-test when it changes |
| Treating a pass grade as a life estimate | A grade ranks suitability and does not predict service hours | Use immersion testing for critical duty and set a review date |
| Confusing degradation with permeation | The chart describes degradation, not through-wall passage | Ask about permeation separately for volatile media |
The material identity reference helps you keep material identities straight, which is where the concentration and grade mistakes usually begin. A hose material compatibility error is rarely a mystery after the event; it is almost always one field read too loosely against a generic chemical resistance table.
Two habits prevent most of these errors. First, never read a grade without its header. Second, when the duty is critical, write the medium and its conditions on the request for a test so the result comes back usable. A grade copied across a page, without its row and its column, is not a decision.
Häufig gestellte Fragen
What is a hose chemical resistance chart?
A hose chemical resistance chart is a grid that lists media on one axis and tube materials on the other, with a grade in each cell. The grade describes how a material behaved when it was exposed to that medium under the conditions the chart states. It is a screening aid, so it points you toward candidate materials. It is not a guarantee for your own concentration, temperature and contact pattern.
How do I read a hose chemical resistance chart correctly?
Read the header rows before the cells. The headers carry the medium and its concentration, the temperature and the exposure duration the rating was measured at. Only then does the grade in the cell have a meaning you can apply. If a header is missing, treat the grade as unusable for your service and ask for the test conditions in writing.
What does a rating of good actually mean?
A word such as good means only that, under the conditions the chart states, the material showed an acceptable result to whoever compiled the chart. It does not mean good for every concentration, temperature or contact time. Two charts can label the same compound good and poor for the same chemical because they measured different conditions. Read the word together with its test condition.
What four conditions change a chemical resistance rating?
Four conditions set every rating: the medium identity including its concentration, the temperature, the exposure duration, and whether contact is continuous or intermittent. Change any one and the grade can move. A chart that prints only the medium name hides three of the four. Record all four for every medium on your list before you select a tube.
What does a chart leave out that a lab test measures?
A chart is a screening aid compiled from many sources and compressed onto a page. An immersion test is a measurement: a coupon of the material is held in the liquid under stated conditions and its change is recorded. The chart helps you shortlist a material, and the immersion result is the decision tool for a specific medium and condition.
What does ASTM D471 report?
ASTM D471 covers rubber immersed in a liquid. It reports volume swell, hardness change, and tensile and elongation change for the material after a defined exposure. Those values describe how the rubber itself changed. A chart does not report them, which is exactly why a chart cannot replace the test for a critical duty.
What does ASTM D543 cover?
ASTM D543 covers the resistance of plastics to chemical reagents. It reports the mass and property change of a plastic specimen after a defined exposure to the reagent. For a plastic-lined or thermoplastic hose tube, it is the relevant immersion method. As with D471, the result belongs to the specimen and the stated exposure, not to every hose of that material.
Is chemical degradation the same as permeation?
No. Degradation is a change in the tube itself, such as swelling, softening or loss of strength. Permeation is the passage of the medium through the wall, which can happen with little visible change to the tube. A material can permeate a medium without degrading, and can degrade with little permeation. Check both, because they fail a hose in different ways.
Why should I not reuse a chart across grades of the same compound?
Grades of the same compound differ in cure, filler and plasticizer content, so a rating measured on one grade does not transfer to another. Reusing a chart across grades of the same compound is a common source of field failure. Ask which grade and which test the rating came from, and re-test when the grade changes.
How do I build a working chart for my own media list?
Start from your own media list, not a supplier chart. For each medium record the concentration, the service temperature range, the contact pattern and the chosen tube material. Add the test basis for the grade and a review date. Keep it to one page per plant area so operators will use it. Then confirm each entry with an immersion test where the duty is critical.
About HENGHUA
HENGHUA is a hose manufacturer supplying distributors, chemical plant operators, EPC contractors, tank-terminal operators and OEM programs. The chemical range covers chemical discharge hose rated at 150 psi and chemical suction and discharge hose rated at 150 psi and 250 psi, alongside steam, water, oil, material-handling and multipurpose lines. Inner diameters run from 3 mm to 102 mm, equal to 1/8 in to 4 in.
The plant covers 35,000 m² with 95 production lines and a capacity of 20 million meters per year. Quality management is certified to ISO 9001, IATF 16949 and ISO 14001. An in-house laboratory runs burst testing to ISO 1402 and impulse testing to ISO 6803, supported by 45 QC inspectors and 25 R&D engineers holding 30+ patents. The company employs more than 320 people, exports to more than 70 countries and sits about 90 km from Shanghai port.
The material call-outs published for this range cover four compounds. EPDM suits hot water, steam up to +165 °C, brake fluid and dilute acids. For oil service, use NBR or FKM. FKM suits high-temperature oils and aggressive chemicals up to +200 °C. PTFE suits nearly all chemicals across −70 °C to +260 °C. NBR suits mineral oils, diesel and hydraulic fluids.
OEM, private-label and cut-to-length programs are supported. Send the medium, concentration, temperature, contact pattern and bore, and we will tell you which entries a chart can settle and which need immersion testing. To discuss a specification, contact our technical team. You can read more about HENGHUA for production and quality detail.

 English
  Spanish
  Portuguese
  French
  German
  Arabic
  Russian
  Indonesian
  Japanese
  Korean